Part Properties Charts
Visualize assembly parts, meta data, and physical properties in part properties charts. SpinFire Ultimate provides nine chart types to choose from.
Add the charts and data to your report, presentation, website or spreadsheet to provide your visual analysis.
Properties
View part names, part quantities, available meta data, and physical properties in the list of properties at the top of the Part Properties Chart dialog window.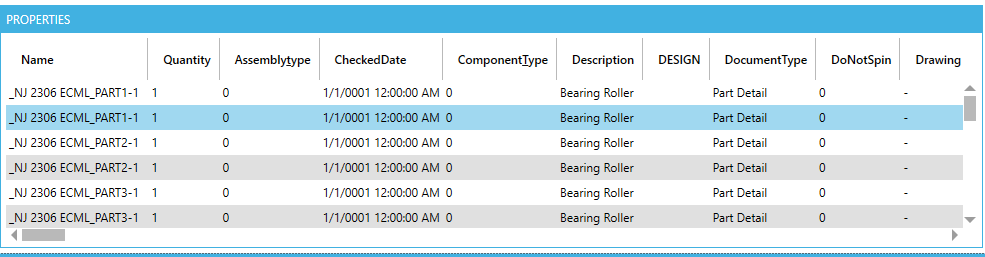
Selecting a row of data in the list of properties, highlights the associated chart elements in the Chart section as well as the associated items in the Assembly tree and the graphical area.
Use the CTRL key with mouse clicks to select multiple non-consecutive rows.
Use the SHIFT key with mouse clicks to select a set of consecutive rows.
Chart
View the created chart based on the chart type, category, view, value, and level.
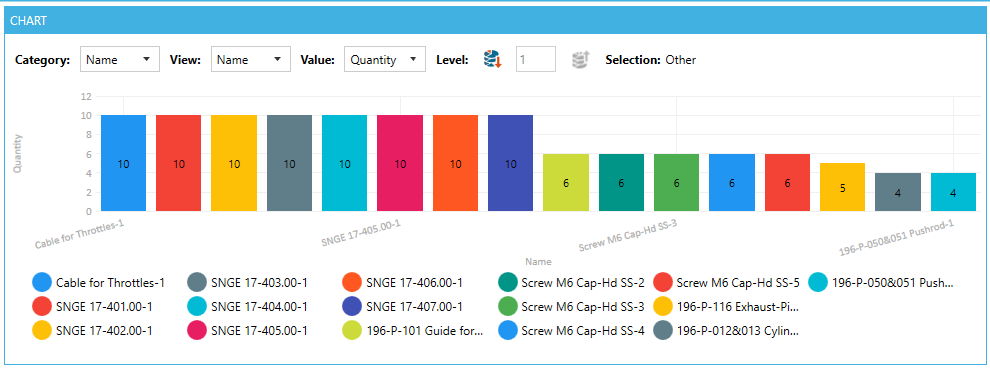
Clicking on a chart part to highlights the associated properties rows in the Properties section as well as the associated items in the Assembly tree and the graphical area.
Category
Select a category which can be the part name, part quantity, or meta data field in the CAD file.
X-Category & Y-Category
X-Category and Y-Category fields are available for the Heat Map chart.
View
Select a category which can be the part name, part quantity, or meta data field in the CAD file. (found in column breakdown charts and stacked column charts)
Value
Select meta data from the CAD file or a physical property (surface area or volume) to use as the values of the category selected.
X-Value & Y-Value
Select multiple values in the case of mapping a scatter chart or bubble chart.
Level
Drill down further or back up via the drill down 

Part Properties Charts have a number different charts to choose from.
To select a different chart type,
- Use the Chart Type pull down and select the chart type that is appropriate for the data selected.
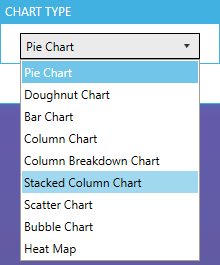
Chart Types
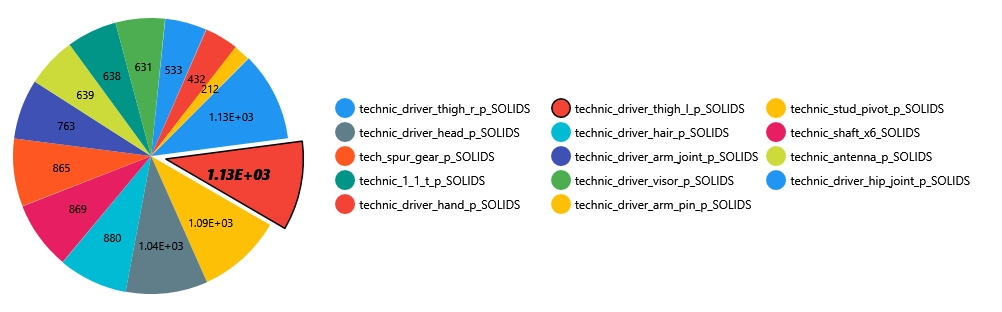
Pie charts compare parts to the whole as in parts of an assembly to the assembly itself.
Clicking on a pie slice,..
- Separates it from the reset of the pie,
- Selects the associated part(s) in the graphical area,
- And selects the associated part(s) in the assembly tree.
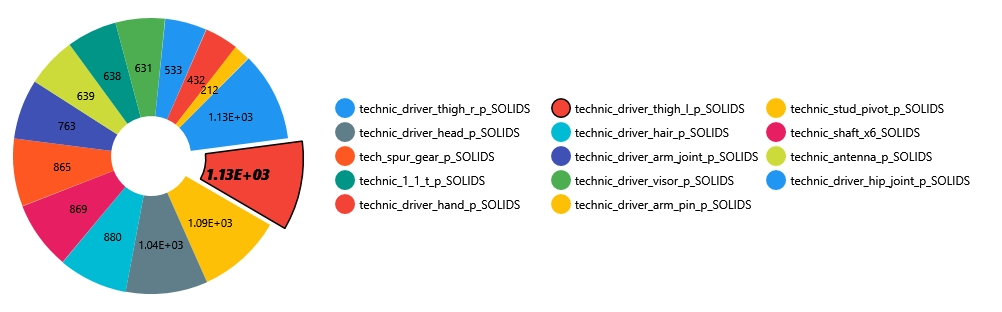
Doughnut charts compare parts to the whole especially when there's more the one series of data.
Clicking on a doughnut section,..
- Separates it from the reset of the doughnut,
- Selects the associated part(s) in the graphical area,
- And selects the associated part(s) in the assembly tree.
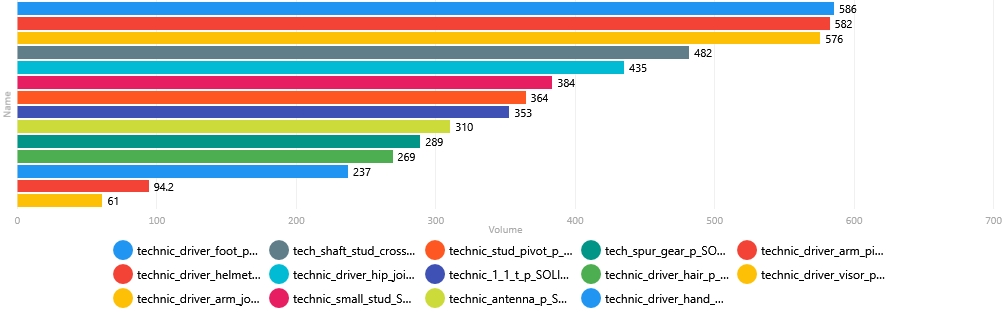
Bar charts compares items side-by-side especially when labels are too long to display vertically
Clicking on a bar,..
- Selects the associated part(s) in the graphical area,
- And selects the associated part(s) in the assembly tree.
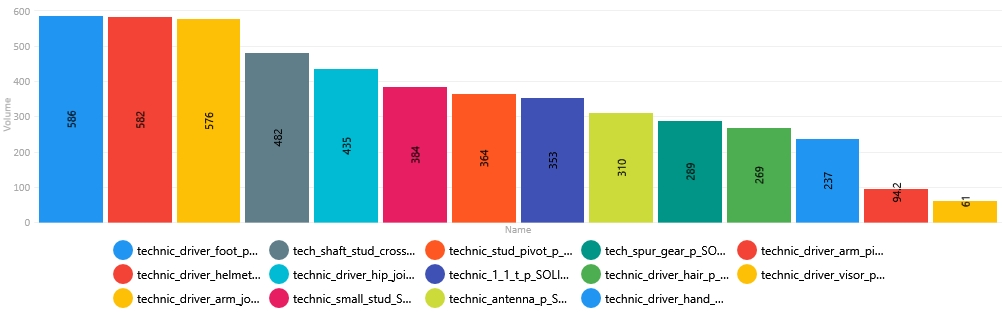
Column charts compares values side-by-side across categories.
Clicking on a column,..
- Selects the associated part(s) in the graphical area,
- And selects the associated part(s) in the assembly tree.

Column breakdown charts compare data side-by-side showing part-to-whole relationships.
Clicking on a column,..
- Selects the associated part(s) in the graphical area,
- And selects the associated part(s) in the assembly tree.
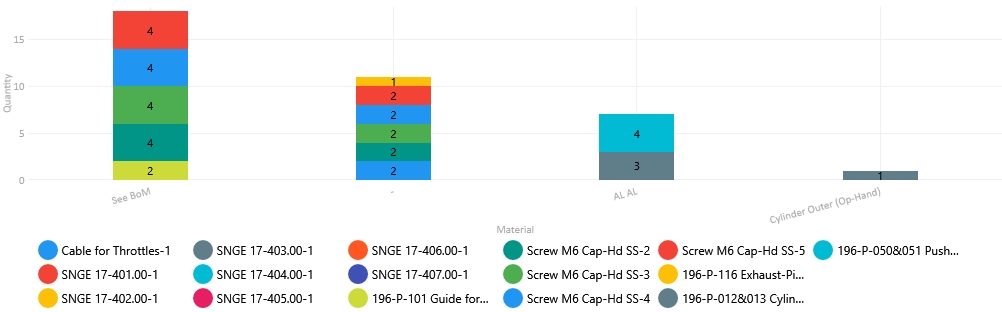
Stacked column charts compare like data as well as showing part-to-whole relationships.
Clicking on a column section,..
- Selects the associated part(s) in the graphical area,
- And selects the associated part(s) in the assembly tree.

Scatter charts exhibit sets of data to show if there is a relationship between the data.
Clicking on a circle,..
- Selects the associated part(s) in the graphical area,
- And selects the associated part(s) in the assembly tree.
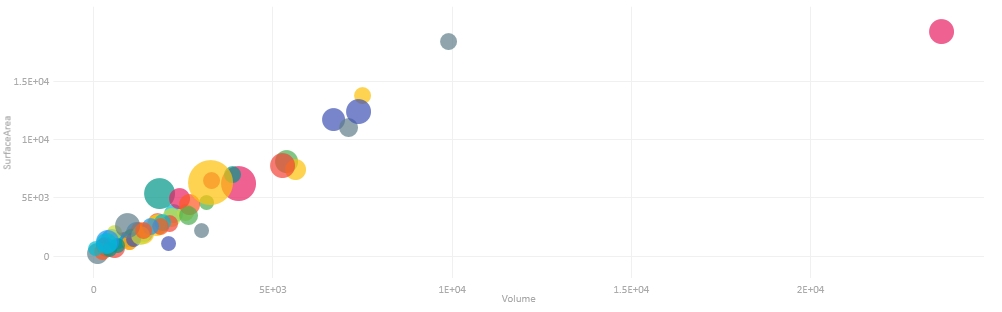
Bubble charts are used when your data has three data series that each contain a set of values. The sizes of the bubbles are determined by the values. Bubble charts are often used to present financial data.
Clicking on a bubble,..
- Selects the associated part(s) in the graphical area,
- And selects the associated part(s) in the assembly tree.
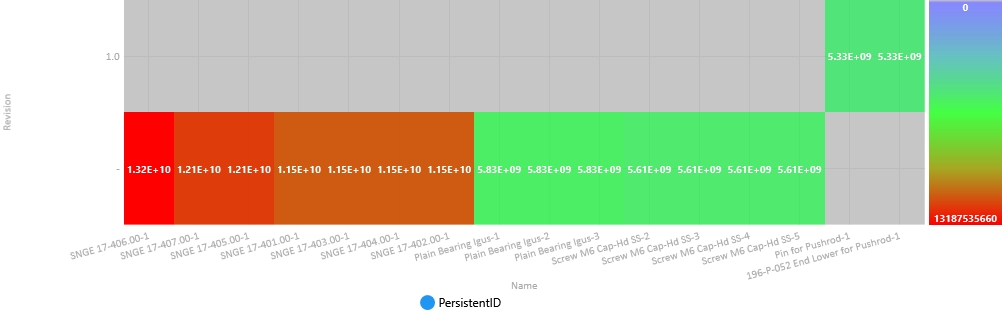
Heat maps typically show varying levels/ranges of values with shades of colors.
Clicking on a heat section,..
- Selects the associated part(s) in the graphical area,
- And selects the associated part(s) in the assembly tree.
Check Show Physical Properties to chart against physical properties. The properties are available from the Value pull down.
- Surface area
- Volume
- Weight
- Minimum Box Dx
- Minimum Box Dy
- Minimum Box Dz
Note: When enabling, physical properties are recalculated. Depending on the number and complexity of parts this may take a few seconds.
To copy properties to the clipboard
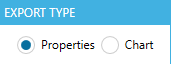
- For the Export Type, select Properties.
- Click COPY...
To copy the chart to the clipboard
- For the Export Type, select Chart.
- Click COPY...
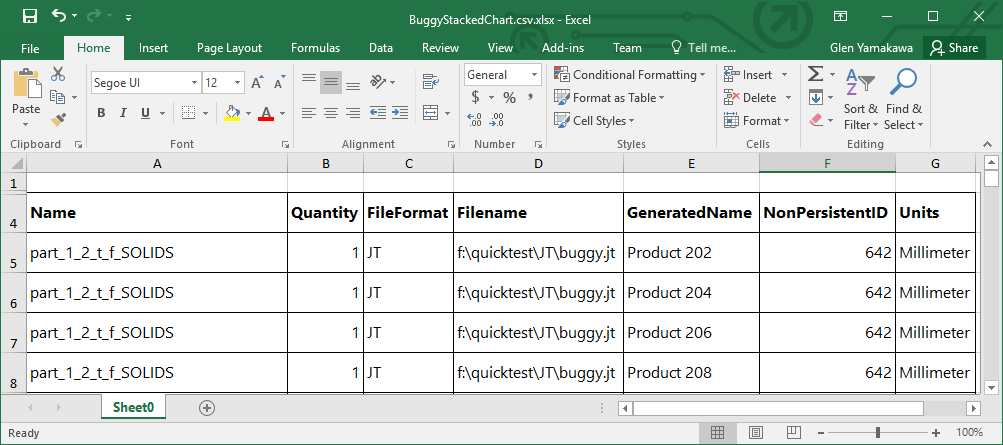
To export properties
- For the Export Type, select Properties.
- Click Export...
- Enter a file name.
- Select a file type. Choose,
- txt
- csv
- xml
- xsl
- xlsx
- Click Save.
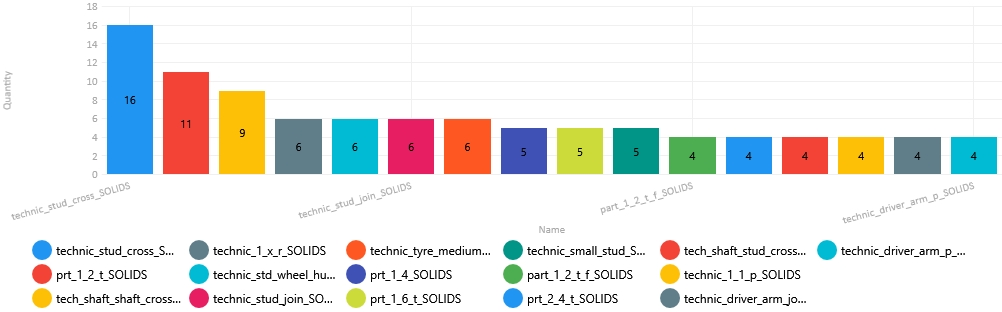
To export chart
- For the Export Type, select Chart
- Click Export...
- Enter a file name.
- Select a file type. Choose,
- bmp
- emf
- exif
- gif
- jpeg
- png
- tiff
- wmf
- Click Save.
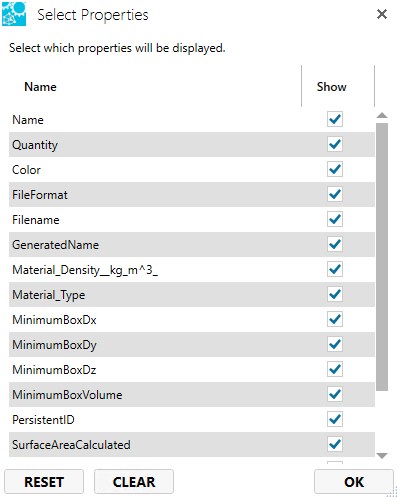
Click SELECT PROPERTIES to hide and show property columns in the Properties panel.